By Christopher Young,
Contributing Writer,
In partnership with American Community Media – National Briefing Series
Until now, no one had fully detailed or mapped who gets deported in the U.S. We often hear numbers from administrations eager to prove how tough they are on “enforcing immigration laws.” But what really determines who gets targeted?
Three scholars at UCLA’s Center for Immigration Law and Policy and the Million Dollar Hoods Project have spent years gathering and analyzing deportation data, producing maps and visualizations that trace policies back to 1895. Their work unmasks patterns of deportation that explain where we are today, and why.

Photo per: www.history.ucle.edu.
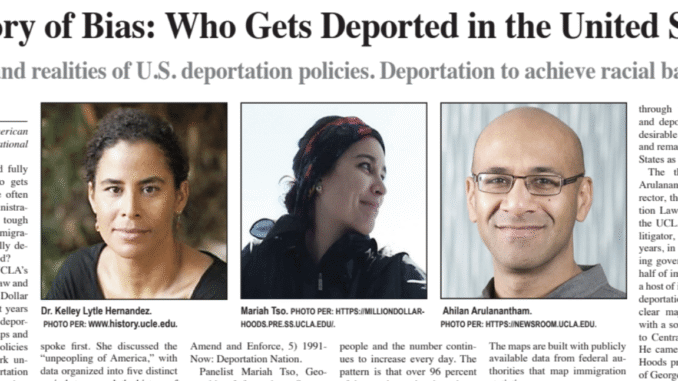
Panelist Kelly Lytle Hernández, the Thomas E. Lifka Endowed Chair in History at UCLA and founding director of Million Dollar Hoods, a website five years in the making, spoke first. She discussed the “unpeopling of America,” with data organized into five distinct periods to unmask the history of racism in U.S. Immigration Enforcement. The periods are: 1) 1790-1876: The Roots of Immigration Control, 2) 1877-1929: The Whites-Only Regime, 3) 1930-1954: Consolidate and Carry Forward, 4) 1955-1990: Amend and Enforce, 5) 1991-Now: Deportation Nation.

Panelist Mariah Tso, Geographic Information System (G.I.S.) Specialist with Million Dollar Hoods at UCLA, took the lead on creating the maps which are a must-see at the link below. “There have been well over 8 million deportation orders since 1895, totaling over 50 million people and the number continues to increase every day. The pattern is that over 96 percent of deportation orders have been issued to people from predominantly non-white countries – racial banishment. And this isn’t random. It’s a reflection of policies steeped in racism. We’ve collected the data from 1895 – 2022, and so much is revealed.” The maps are built with publicly available data from federal authorities that map immigration statistics.
Reviewing the maps associated timelines and data, the U.S. Government, regardless of political party, and the U.S. Supreme Court have enacted and/or made rulings eighty-one times in the period from 1790 through 2022 to acquire land and deport people it finds undesirable. The goal is always, and remains, making the United States as white as possible.

Photo per: https://newsroom.ucla.edu.
The third panelist, Ahilan Arulanantham, Faculty Co-Director, the Center for Immigration Law and Policy (CILP) at the UCLA School of Law, is a litigator, for nearly twenty-five years, in federal court challenging government policies on behalf of immigrants. He spoke to a host of impacts over time from deportation policies and that the clear majority are to Mexico, with a somewhat lesser number to Central American countries. He came to the Million Dollar Hoods project after the murder of George Floyd and the nationwide protests.
“I was struck by how stark the race discrimination cases against the federal government involving immigration policy were. Then came the Muslim ban, then the litigation over temporary protected status. I’m still working on that now and it impacts well over one million people, a lot of them from Venezuela and Haiti, but Central American countries and other countries as well. Even during the Biden administration, the racial discrimination in immigration policy was evident. It very easy to trace the racist origins of the law and policies we see today.
Arulanantham continued, “Just to give one example, the application of the Title 42 program.
Excluding people from the country on the basis of COVID was applied very harshly to Haitians and to, you know, other people from Central America. And then, just like that, virtually all Ukrainians were exempt from the program, and allowed to come in.”
GIS Specialist Mariah Tso provided an overview of the sixteen maps, each depicting deportation in various points of history and for various reasons – all resulting in maintaining the United States as a white-centric nation. All of the maps are interactive and can be viewed and studied here: https://mappingdeportations.com.https://milliondollarhoods.pre.ss.ucla.edu/our-work “How does America First create a distorted view of the world? Who is racialized and how? Who is criminalized, who is banned, barred, and capped?”
With over eighty media outlets on the Zoom call, American Community Media’s Pilar Marrero, serving as moderator extraordinaire, managed to field about thirty questions for the panelists, including a question from The Mississippi Link newspaper – “Mississippi is known as the largest incarcerator in the world, per World Population Review. Is this just a freakish outcome of the last state to let go of their Confederate States of America moniker, or a more deeply ingrained component of racial banishment?” Dr. Hernandez answered, saying, “I don’t know if I have an answer to that. I mean, you can look at all different kinds of data points. Oklahoma often has the highest rate of incarceration. Mississippi might have the highest numbers, but these are all legacies of enslavement and removal with Black and Indigenous folks facing the highest rates of incarceration across the country. I’ll just add Louisiana has the highest number of immigration detention centers now, which is striking, given how small it is, and we have a visualization which shows the connection of mass incarceration and deportation. It’s amazing. It’s like, they go exactly almost in lockstep…and the South has the most 287(g) agreements.” 287(g) agreements allow local law enforcement to perform certain duties alongside Immigration and Customs Enforcement officers.
This week’s entire briefing, can be viewed here: https://americancommunitymedia.org/media-briefings/a-history-of-bias-who-gets-deported-in-the-united-states.

Be the first to comment